Process Injection on Linux - Injecting into Processes
This article is part 2 of a 5 parts series on process injection on Linux.
In the first article of this series, I presented a few key concepts required to understand process injection and finished by a definition of the technique. In this article, I want to introduce the reader to process injection through a hands-on approach. Whether we're thinking about red teamers or blue teamers, I believe this approach will encourage readers to ask themselves questions (which I'll try to answer here) and is best suited for them to become autonomous. Do note, however, that, from this part of the series onward, the content is highly technical in nature1. If some things in the 101 section of part 1 were new to some readers, I encourage them to do some research and experiments when they have questions. I'm assuming an advanced technical expertise.
In this part, the reader should put an attacker hat on as I detail process injection through a step-by-step process. I'll begin by presenting an elementary injection technique and improve it gradually. Following that, a more structured definition of process injection will be introduced and I'll use this structure to explore injection techniques further. Also, to keep the content below relatively digestable, I'll omit some injection variants and will present them in part 4.
All techniques presented in this article have proof of concepts (PoCs) available at https://github.com/antifob/linux-prinj/
The first injection
Let's go back to the process injection definition I gave in part 1:
Process injection is a post-exploitation technique [...]. It is performed by injecting malicious code into a host process's address space and executing it.
This definition implicitly states that the attacker has an arbitrary code execution capability. In practice, this capability could have been acquired, for example, by exploiting a vulnerability such as a buffer overflow or a command injection, or through a compromised account. Once this capability is acquired, the technique is to inject malicious code into a process's address space. Do note that the usual interpretation is that other processes are targeted, but that need not to strictly be the case. In the case of a buffer overflow, for example, it might be easier to inject a small stager into the vulnerable process and then move on to load a bigger agent from there. In any case, once arbitrary code execution has been acquired, a piece of code is injected into a host process and executed.
In this section, I'll start by demonstrating a simple injection technique and gradually improve it until it matches better the above definition. In the next sections, I'll explain in greater details what's actually going on.
All Hail ptrace
The open source nature of the Linux kernel makes it pretty easy to research facilities that can be leveraged for injection. Quite unsurprisingly, not many of the system calls allow manipulating another process's address space; UNIXes are well-known to have compact, but powerful system calls. For this research, I started by looking at the system calls that take a process identifier (pid) as one of their arguments and read their manual pages. Wanting to get my hands dirty, I followed with developing a proof of concept before looking for existing documentation on them.
ptrace is the most well-known system call for process injection. This
powerful facility allows for reading and writing a process's
address space and CPU registers (among other things). While it is
usually used for debugging (e.g. gdb and strace) or instrumentation
(e.g. valgrind and RASPs), it is obviously powerful enough to
enable malicious activities. This particular injection technique is
documented on the ATT&CK framework and given the identifier
T1055.008.
Looking at ptrace's manpage, we can see that it is designed to
take an operation/request, a target process
identifier, an address and a data pointer (a buffer) as its arguments.
long ptrace(enum __ptrace_request request, pid_t pid, void *addr, void *data);
Also, the calling process first needs to "attach" to the target process
to establish what's called a tracer-tracee relationship; the tracer
being the calling process. PTRACE_ATTACH seems well indicated; it
attaches to the target process and stops/suspends it for the next
requests. PTRACE_DETACH, aptly named, does the opposite and detaches
from the tracee before resuming it. Next, PTRACE_GETREGS and
PTRACE_POKETEXT are interesting. They allow the tracer to get
the general-purpose registers' value of the suspended tracee and write
to the tracee's memory space, respectively. Quite quickly, an injection
technique can be built that looks like the following:
/* Attach to and pause the target process. */
ptrace(PTRACE_ATTACH, $TARGET_PID, 0, 0);
/* Read the process's RIP register (pointing to an executable page). */
ptrace(PTRACE_GETREGS, $TARGET_PID, 0, ®s);
/* Overwrite the next opcodes with our shellcode. */
ptrace(PTRACE_POKETEXT, $TARGET_PID, regs.rip, code);
/* Let the process resume. */
ptrace(PTRACE_DETACH, $TARGET_PID, 0, 0);
Looks simple right? A PoC built on this design is available at
https://github.com/antifob/linux-prinj/blob/main/01-ptrace/
You'll notice that I also inserted a waitpid syscall (system call)
after
PTRACE_ATTACH. That syscall waits for the given process (identified
by its pid) to be stopped. This step is necessary as the
tracee might actually run for a little while after PTRACE_ATTACH
returned. Until the process is fully attached to, ptrace will
simply refuse to execute other requests.
The careful reader will have noted a couple of things. First, the PoC
trashes the target process's execution; the process simply crashes when
the shellcode ends. By changing the execution flow the way the
PoC did, the shellcode had no ability to resume the process. In reality,
however, that does not matter much because the second issue is that,
by writing the injected code in the program's execution path, it
overwrites the program's code. Even if the shellcode was able to resume
execution, the process will go back to a weird unexpected state and end up
misbehaving or crashing. Finally, if the injected code doesn't fit
in the memory area up to the page's end (assuming the next page isn't
mapped), ptrace will not be able to fully write the code to inject;
leaving us with a truncated shellcode.
While it's not elegant, technically, a process injection was performed: "Process injection [...] is performed by injecting [...] code into a host process's address space and executing it".
Injection without crashing
Let's take care of the above issues and rewrite the injection. First, we'll need a way for the shellcode to resume the host process as if nothing happened; we don't want it to terminate. Second, we'll need to write the code to a memory area that shouldn't be used by the host process; we don't want it misbehaving. Finally, we'll need to ensure that, wherever we write to, we'll have enough space to write the full code; whatever its size is.
To solve the latter two (2) issues, we'll simply invoke mmap from
within the target process and allocate a new memory area large enough
for the shellcode. However, there appears to be a chicken and egg
problem: we need to invoke mmap from within the process before
injecting the shellcode. While technically true, this statement doesn't
take into account that a call to mmap is actually just a syscall
instruction with a bunch of register values prepared. In other words,
we'll perform two (2) injections: a small one for syscall (2 bytes) and
a larger one right after for the shellcode.
We'll first setup the registers and write syscall's
opcode at rip's value before letting the process execute for one (1)
instruction (mmap). Once this is done, we'll read rax value,
and restore the original opcodes and register values. This will yield
the address of a newly-allocated memory block to write the shellcode to.
To do this, we'll use three (3) new ptrace commands: PTRACE_SETREGS
PTRACE_PEEKTEXT and PTRACE_SINGLESTEP. PTRACE_SETREGS, as its name
implies, allows the tracer to set/change the general-purpose registers'
of the tracee, PTRACE_PEEKTEXT allows it to read the memory space
of the tracee, while PTRACE_SINGLESTEP allows it to run the tracee
for a single (1) instruction.
Combined together, the following sequence will be used, at a high level:
/* Grab registers. */
ptrace(PTRACE_GETREGS, pid, 0, ®s);
/* Backup original opcodes. */
origcode = ptrace(PTRACE_PEEKTEXT, pid, 0, 0);
/* Set registers for mmap call. */
ptrace(PTRACE_SETREGS, pid, 0, ®s);
/* Replace the next opcodes with the "syscall" (0f 05) instruction. */
ptrace(PTRACE_POKETEXT, pid, regs.rip, 0x050f);
/* Execute a single instruction ("syscall" -> "mmap"). */
ptrace(PTRACE_SINGLESTEP, pid, 0, 0);
/* Get the return value of mmap; the allocated memory. */
ptrace(PTRACE_GETREGS, pid, 0, ®s);
/* Restore the original state. */
ptrace(PTRACE_POKETEXT, pid, regs.rip, origcode);
ptrace(PTRACE_SETREGS, pid, 0, ®s);
Finally, to allow the shellcode to resume the process, we'll write
rip's value in front of the shellcode, in the allocated memory
area. This will allow the shellcode to grab and jmp to it
when it's done. Obviously, the shellcode will have to ensure that
all registers' value are preserved.
/* Write the original rip value at head of the memory area. */
ptrace(PTRACE_POKETEXT, pid, allocated_mem, regs.rip);
	[return address]
_start:
	jmp     entry
jmpret:
	# Jump back to the address stored before _start
	jmp     [rip-16]
entry:
	# backup registers
	[...]

	call    main

	# restore registers
	[...]
	jmp     jmpret

main:
	# payload
	[...]

	ret
Just like the previous example, there's a bit more going on for a reliable PoC, but the updated code is available at: https://github.com/antifob/linux-prinj/blob/main/02-ptrace-mmap/
We can now execute code inside a target process at will and have the process running flawlessly.
Persistent code injection
The last improvement looks much better, but it's relatively useless to inject code into another process if it's just going to perform some actions and exit; we could have executed the injected code directly to the same effect. As the final step, we'll use a simple mechanism to maintain both the target process's and the injection shellcode's execution active: child processes.
On Linux, to create a process, one calls the fork syscall. Upon return, the caller checks the return value to see whether it's in the parent or child context. Thus, for this technique, it's simply a matter of checking the return value and execute the rest of the shellcode (the child process) or return (the caller, the parent process).
	# Start the child process
	mov	rax, 57		# sys_fork
	syscall

	# Keep going or return
	cmp     rax, 0
	je      child
	ret

child:
	# actual payload
	[...]
The updated code is available at https://github.com/antifob/linux-prinj/blob/main/03-ptrace-mmap-fork/
What we've seen so far
The above experiment allows us to start thinking about the different
elements of an injection. First, the facilities available to write to a
process's memory. We used ptrace, but we'll want to have as many
techniques as possible in our toolset to (1) have the best coverage for
the many different security products out there and (2) check how
forensics team approach different techniques. Second, as we saw, the
injected code's destination can have non-desirable effects on the
process's stability. As such, we'll want to consider all possible
places where our code could be written. As I'll demonstrate in
part 3, this will also impact the injection's footprint;
as some techniques are easier to detect than others. Third, we'll consider
the way our injection technique and shellcode works together to make the
injection non-disruptive (read: allow the host process to be resumed).
Above, we wrote in front of the shellcode, but the more techniques the
better. Fourth, threads were used to maintain execution alongside the
host, but what other facilities are there that can be leveraged for this?
Fifth, and finally, shellcode is cool, but when developing complex
programs such as a C2 agent for our injection payloads, it's much nicer
to use a higher-level language. I'll also look at different ways to
write payloads.
Since there's a lot of ground to cover, from now on, I'll also be developing injection PoCs in Python.
Memory destinations
There are a few factors to consider when selecting where the injected code will reside. As we saw above, first, stability might be adversely affected if code is overwritten. Also, the injected code's size might be an issue if it's large and the target process does not have much memory allocated. With these factors in mind, this section presents various destinations for injected code.
Existing code regions
As we noted above, while overwriting existing code might affect the host process's stability, it is absolutely a valid destination. In practice, we might even consciously decide that the program's stability is irrelevant as we'll just take over the process and simply use it as a disguise. The injection technique known as process hollowing, for example, starts a process, attaches to it before it starts, replaces its program with injected code and lets it run. If we look at reports that uncovered usage of process hollowing, it's undoubtedly a rudimentary, but functional technique.
Also, if we know the targeted program well enough, we could simply write to code regions that are unused (or rarely used). For example, we could overwrite a region of code that handles argument parsing, only used when the program starts, without affecting stability when our injection has been performed. A maybe more obvious region would be, e.g., the C library. Effectively, when used by a program, the whole library gets loaded in memory even though some/most parts of it are never used.
Injection can overwrite parts or all the host process's programs. Such injection may affect a process's stability, depending on whether the overwritten code is going to be part of the process's execution path.
An example of process hollowing is available at https://github.com/antifob/linux-prinj/blob/main/04-hollowing/ and an example injection targeting unused code regions is available at https://github.com/antifob/linux-prinj/blob/main/05-unused/
Allocating memory
The technique I used to preserve the host process's program integrity
involved injecting and executing a small call to mmap before injecting
a bigger piece of shellcode in the newly-allocated memory area. This two
(2) steps technique adds a bit of complexity, but is much more powerful
as it supports injecting bigger (read: more useful) payloads.
Rarely talked about syscalls that are able to allocate memory are
brk and sbrk. They enable a process to modifying
the location of the program break; the end of the process's data
segment. In other terms, it enables a process to resize its .data
section. Simply, brk does it by taking an address and sbrk does it
in increments. Effectively, instead of allocating memory on the heap,
memory is allocated right next to the .data section.
Injection can allocate new memory into a target process's address space in order to inject bigger pieces of codes and preserve the target's program.
Code caves
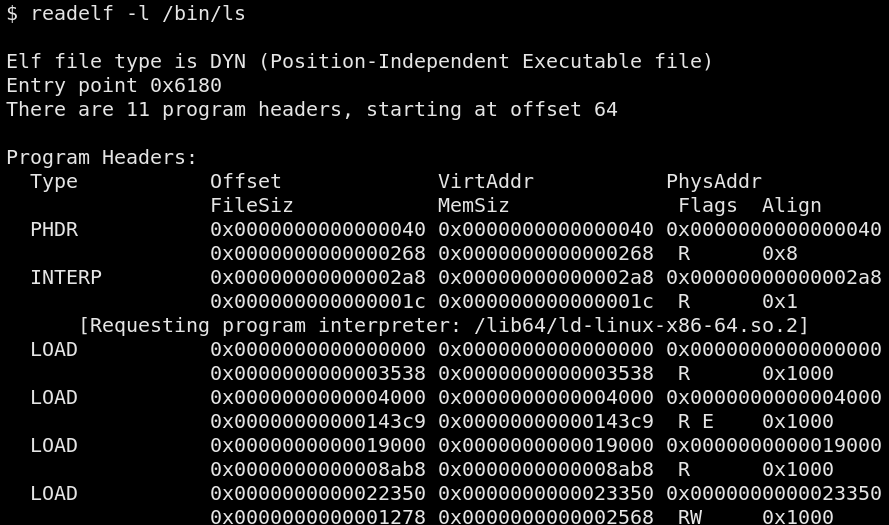
There's another destination we didn't look at yet: code caves.
Essentially, while a program's sections are copied to different memory
pages, each section rarely use the whole page(s). As such, there is
usually a gap between what's used by the program and the end of the
page(s). This unused area, called a code cave, is another location
where shellcode can be written to. In the screenshot below, notice how
much memory is used by the .text section and that it's not a multiple
of 4096 (a page) bytes.
You can either make your code cave injection adaptative or targeted. An adaptative injection loader first iterates over the running processes, inspects their structures for a suitable (e.g. big enough, already marked executable, etc.) code cave before writing to it. When an injection is targeted, the code caves of the target program are already known and its simply a matter of locating a process executing that particular program.
Injection can target code caves, free memory regions in already-allocated pages.
A code cave injection PoC is available at https://github.com/antifob/linux-prinj/blob/main/06-codecave/
A word about PIEs and ASLR
Position-Independent Executables (PIEs) allow binaries to be loaded at
arbitrary memory addresses; instead of using hard-coded addresses. This
feature originates from shared libraries, but can be applied to
executables too; and is actually required for Address Space Layout
Randomization (ASLR) to be supported. Anyways,
nowadays, Linux distributions ship most programs as PIEs and enable
ASLR by default. As such, code cave injection on modern systems
usually require reading the memory mapping (available at
/proc/<pid>/maps) of the target process to locate the position
of the code cave in a process's memory. This contrasts with non-PIE
processes that are always loaded at the same address.
For example, on Debian-based systems, the Python interpreter is not (always) compiled as a PIE23 while on Arch, it is.
Targeting the code caves of PIEs when ASLR is activated requires knowledge of the process's address space: also known as "breaking ASLR".
A word about executable pages
I mentioned, in part 1, the memory pages have protection flags. If a
process tries to execute code in a non-executable memory page, a
memory access violation error occurs. It's important to know that,
whatever the page, its protection flags can be changed at any time by
using mprotect(2). For example, if one wrote the injected
code inside a rw code cave, they would have to invoke mprotect to
add the x flag before being able to execute it. If one's allocating
memory with mmap, one can simply add the PROT_EXEC flag in
its 3rd argument (flags).
Maintaining execution
While we can simply trash the host process and use it as a disguise, as we saw in the first section of this post, being able to maintain execution alongside the host process is much more interesting. This section presents different facilities that can be leveraged to maintain execution inside a host.
Parallel execution using child processes
Using child processes, as we saw earlier, is a simple and effective
way to maintain execution. One simple calls fork and checks the
return value. Processes are also resilient since they have their own
execution context; separated from the parent. As such, if the parent
dies, its children, under normal conditions, keep running.
See https://github.com/antifob/linux-prinj/blob/main/03-ptrace-mmap-fork
for a PoC using fork.
	# Setup a child process
	mov	rax, 57		# sys_fork
	syscall

	cmp	rax, 0
	je	child
	ret

child:
	[...]
This technique requires the capability to run arbitrary code inside the target process as the
forksycall must be called from the host process's execution context.
Parallel execution using threads
A technique closely related to child processes are threads.
Similarly to child processes, the injected code will run alongside the
host process, but, contrarily to child processes, they'll be terminated
as soon as their host process dies. This technique is less resilient to
short-lived and buggy injected processes, but have the benefit of being
less prone to detection. Effectively, threads require a deeper
inspection of a system to be detected. They won't, for example, be
listed in the common ps auxf output.
To use threads, the clone syscall is available. This syscall
is quite complex so I'll only cover what's relevant to the task. First,
to create a thread, the caller must provide the memory area that will
be used by the thread as a stack area so one can be setup using mmap,
but one could also use a code cave for this purpose. A call to clone
may look like the following:
clone(CLONE_VM|CLONE_THREAD|CLONE_SIGHAND, stack, 0, 0, 0);
The flag means the following:
CLONE_VM
: The thread will share its memory space with the caller/parent.
CLONE_THREAD
: We want to spawn a thread.
CLONE_SIGHAND
: The thread will share the caller/parent's signal handlers.
An injection payload leveraging threads is available at
https://github.com/antifob/linux-prinj/blob/main/07-clone
Note that it is a simple variant of 03-ptrace-mmap-fork; where the call
to fork was replaced with one to clone (plus mmap).
	# Setup a stack for the thread.
	mov	rax, 9		# sys_mmap
	mov	rdi, 0		# base address (0=anywhere)
	mov	rsi, 0x2000	# len (2 pages)
	mov	rdx, 3		# PROT_READ | PROT_WRITE
	mov	r10, 0x22	# MAP_ANONYMOUS | MAP_PRIVATE
	xor	r8, r8		# -1
	dec	r8
	xor	r9, r9		# 0
	syscall

	# Start the thread
	mov	rsi, rax
	add	rsi, 0x2000	# top of the stack
	mov	rax, 56		# sys_clone
	mov	rdi, 0x10900	# CLONE_VM | CLONE_THREAD | CLONE_SIGHAND
	xor	rdx, rdx
	xor	r10, r10
	xor	r9, r9
	syscall

	cmp	rax, 0
	je	child
	ret

child:
	[...]
This technique requires the capability to run arbitrary code inside the target process as the
clonesyscall must be called from the host process's execution context.
Please note that fork can practically be replaced with clone;
based on the flags provided.
Leveraging the signaling facility
UNIXes have a signaling facilities that, essentially, allows the kernel and other processes, to communicate that a particular event happened. Since signals do not query data, there are multiple signal values for different meanings. The POSIX standard specifies a common set of signals and a set of "real-time signals" that are essentially a range of signals to be used however programs want to. Whenever a particular signal is sent to a process, a piece of code associated with it, a handler, is executed. Now, processes must opt to handle particular signals. If a signal is not handled, a default action is taken by the kernel and the action depends on the signal; some terminate the receiving process while some terminate it, for example.
To maintain execution, an attacker can replace an existing handler or register a new one to execute the injected code. Afterwards, whenever that signal will be emitted to the process, the attacker's code will be executed.
signal is the simplest signal-management syscall. It takes
a signal number and handler location as a routine, and replaces the
current handler and returns the previous one. sigaction
provides more flexibility than signal(2), but essentially performs the
same task.
An injection payload leveraging signals is available at https://github.com/antifob/linux-prinj/blob/main/08-signals
This technique requires the capability to run arbitrary code inside the target process as the signals-related facilities must be called from the host process's execution context.
Leveraging timers
An other interesting hooking facility is the timer subsystem. Simply, a process instructs the kernel to receive a notification when a certain amount of time passed; either by delivering a signal or by executing a particular code in the context of a thread.
The first timer-related syscall we'll look at is setitimer.
Its first argument indicates the signal (either SIGALARM, SIGVTALARM
or SIGPROF) to deliver upon timer expitation, and, the second, a time
interval with a microsecond resolution.
The second syscall is timer_create. It takes a clock source (e.g. monotonic or wall-bound) and a set of delivery parameters controlling the delivery method: signal number or code location. Once the timer is created, it is armed with timer_settime.
https://github.com/antifob/linux-prinj/blob/main/09-timers
This technique requires the capability to run arbitrary code inside the target process as the timers-related syscalls must be called from the host process's execution context.
Hooking the Global Offset Table
As mentioned in part 1, a dynamically-linked program specifies a list of
symbols it need to run and, when the program is started, the loader
goes and finds those symbols in dynamic libraries. But since dynamic
libraries are loaded at random locations, one would ask: how does the
program know where those symbols are in randomly-located libraries?
Each dynamically-linked program has a relocation table that is filled by
the loader and that contains the address of those symbols. Essentially,
whenever a program refers to a symbol, it looks up that table,
reads the address associated with the symbol and uses that. For example,
the printf function is part of the C library (libc.so); not the
programs using it. When the loader sees that printf is required, it
goes on to resolve the symbol4 by loading libc.so in memory
and find where printf is finally located. It then places the address
in the table for usage by the program.
This table, called the Global Offset Table (GOT), can, under certain circumstances (more on this in part 3), be altered for hooking. The technique consist in writing a piece of code in memory and substitute an address in the GOT by the address of that piece of code. Once substituted, whenever the symbol is referenced, the injected piece of code's address is returned instead. This technique, known as GOT overwrite, is frequently encountered in CTF challenges when arbitrary write gadgets are present.
A demonstration of this hooking technique is available at https://github.com/antifob/linux-prinj/blob/main/10-got
GOT hooking requires the ability to write to arbitrary memory and knowledge of the GOT's location (relative to where the program is loaded in memory). Hooking can be performed during the loading phase or after, from inside or outside the host process's execution context.
Hooking the vDSO
The Virtual Dynamic Shared Object (vDSO) is
an in-memory shared library
managed by the Linux kernel. It is meant to improve the performance
of applications frequently performing particular syscalls by providing
alternatives that do not require (the performance penalty associated
with) a full userland-kernelland context switch. This shared library
is composed of two (2) sections: a .data section and a .text
section; which correspond to the [vvar] and [vdso] memory
segments, respectively. The data section is mapped read-only and
contains variables controlled by the kernel and used by the
library's code.
This injection technique is documented on the ATT&CK framework and
given the identifier T1055.014.
It is possible to leverage the vDSO memory segment to inject code (since its mapping is executable) and as a hooking mechanism. The technique is to either substitute an existing function with shellcode, or write the shellcode to the vDSO's code cave and hook an existing function to redirect execution.
A program demonstrating this technique is available at https://github.com/antifob/linux-prinj/blob/main/11-vdso/
vDSO hooking requires the ability to write to pages mapped non-writable and knowledge of the segment's location. Hooking can be performed during the loading phase or after, from inside or outside the host process's execution context.
Redirecting execution
Having covered different facilities to write to memory and multiple hooking techniques, it's now time to look at ways to redirect execution. We've already covered most of them in previous sections:
- ptrace;
- hooking the GOT;
- hooking the vDSO;
- stack overwrite.
Just like the classic buffer overflow exploits, it is possible to execute injected code by modifying the stack. Since this is one of the first topic of binary exploitation, I won't explain how it works and provide a PoC that replaces a function's return address to point to the injected shellcode: https://github.com/antifob/linux-prinj/blob/main/12-stack
It is possible to modify the stack to redirect execution to an arbitrary location.
Writing code in memory
Now that we have covered memory destinations, let's look at the facilities that allow a process to write to another process's memory.
ptrace
I skimmed over ptrace in the first section, but let's look at the
details. As documented in ptrace(2), this system call
allows a process to "observe and control the execution of another
process [...]. It is primarily used to implement breakpoint debugging
and system call tracing". As we've seen, its pretty powerful and
perfect for injection.
Note that ptrace has a much bigger API than what is presented in this section. Here, I only try to present the main elements relevant to injection.
Attaching to a process and detaching
To trace another process, a process first "attaches" itself to the target to establish the tracer-tracee relationship, and before being able to issue control commands. However, not any process can trace any other process. Tracers must have the rights to do so. In its default configuration, Linux bases this decision on the user's credentials and capabilities and the process's credentials and capabilities. If there's a risk of exposing sensitive data or capabilities to the controlling user, attaching to the process will fail.
ptrace provides three (3) commands to attach to a process:
PTRACE_TRACEME- used by a child process to indicate to the parent that it is ready to be traced;PTRACE_ATTACH- establishes a tracer-tracee relationship with the target and stops/suspends the target;PTRACE_SEIZE- establishes a tracer-tracee relationship with the target without stopping the target.
In practice, PTRACE_TRACEME is usually performed between a call to
fork(2) and a call to execve(2). It allows for a parent, usually
a debugger, to trace arbitrary programs as soon as they are started.
Once signaled, the parent can then issue ptrace's control commands
on the child.
PTRACE_ATTACH and PTRACE_SEIZE are essentially similar, they attach
the caller to the target process, with the exception that
PTRACE_ATTACH sends SIGSTOP to the target; PTRACE_SEIZE requires
an additional call, PTRACE_INTERRUPT to stop the tracee.
In all cases, the tracer must wait for the tracee to be stopped before
being able to issue commands. This is usually done with the wait
family of system calls; such as waitpid(2).
Programs demonstrating each commands are available in the project's repository.
Reading data
When the tracee is stopped, the tracer can use a variety of ptrace
commands to collect information. The two (2) I've used so far are the
PTRACE_GETREGS and PTRACE_PEEKTEXT. The former, as its name implies,
allows the tracer to get the values of the general-purpose registers
(there's a separate call for FPU registers, PTRACE_GETFPREGS, and then
another, PTRACE_GETREGSET). PTRACE_PEEKTEXT is used to read the
.text section of a process. Well, that's not entirely true, on Linux,
PTRACE_PEEKTEXT can read arbitrary memory regions and is identical to
PTRACE_PEEKDATA; the two (2) can be used interchangeably.
If you read ptrace(2)'s manpage, you'll notice an other PTRACE_PEEK*
command: PTRACE_PEEKUSER. Per its manpage section, it can be used to
"read a word at offset addr in the tracee's USER area, which holds the
registers and other information about the process (see <sys/user.h>)".
Yes, unintuitively,PTRACE_PEEKUSER can be used as an alternative to
PTRACE_GETREGS5.
Writing data
The PoCs also used the following commands to modify the injected-into
processes: PTRACE_SETREGS and PTRACE_POKETEXT. As their name
implies, they're used to set the value of the general-purpose registers
and write data to an arbitrary memory location, respectively.
PTRACE_POKEDATA and PTRACE_POKEUSER have similar semantics.
An important aspect of ptrace's ability to write to memory is that it
completely ignores memory protection flags. Even the target page is not
marked writable, ptrace will happily write to it; this behavior is
sometimes called "punch through". This ability makes it a lot simpler to
perform injection.
Controlling execution
The other ptrace capability that was used in the first section is its
ability to execute a single instruction (called "single stepping" or
singlestep) of the target process. More precisely, the
PTRACE_SINGLESTEP command was used to execute the syscall
instruction in order to invoke mmap and get a new memory region
allocated for the injected shellcode.
This worked beautifully for us because the process was already stopped,
but it was running (because it was restarted without detaching from it
with PTRACE_CONT or because PTRACE_SEIZE was used instead of
PTRACE_ATTACH), PTRACE_INTERRUPT would have had to be used to
stop it first.
Another interesting command to control execution is PTRACE_SYSCALL;
which resumes execution up to the next syscall. There are many others
documented in ptrace's manpage.
Detaching from a tracee
When the tracer is done with its operations, it can detach from the
process using PTRACE_DETACH. If the tracee was stopped, the kernel
transparently issues PTRACE_CONT before detaching. Similarly, if
the tracer terminates without first detaching, the kernel resumes
the tracee.
What we've seen so far
Without a doubt, ptrace is a one-stop shop for process injection.
Due to this, it's long known that it can be abused and is generally
blocked or, at least, detected by security products. Looking to enrich
our toolset, next, we'll look at another powerful facility that can be
leveraged for injection.
/proc/<pid>/mem
The proc(5) filesystem is essentially an API with a
filesystem-like interface. It allows processes to retrieve
various informations about the kernel and processes, and to modify
some kernel parameters and modify processes. What we'll look at,
here, is the /proc/<pid>/mem interface. As you might have guessed,
this virtual file allows users to read and write directly to a
process's memory. Obviously, with everything that can write to a
process's memory, it can be used for injection. The
technique is documented on the ATT&CK framework and given the
identifier T1055.009
/proc/<pid>/mem can be read and written to, just like any other
file, except that the operations must take place on memory-backed
regions. As such, simply use seek to move the read/write offset
around based on the content of /proc/<pid>/maps. Also note that
this interface has the same "punch through" capability6 than
ptrace.
This particular write technique is used in https://github.com/antifob/linux-prinj/blob/main/13-procmem
process_vm_writev
This technique is not part of the ATT&CK framework.
A little known interesting system call is process_vm_writev(2). According to its manpage: the syscall [...] transfers data from the local process's memory to a remote process's memory.
Contrarily to the ptrace and /proc/<pid>/mem interfaces,
process_vm_writev honours memory protection flags. As such, it's
not possible to write to a page that is not marked writable. This
doesn't mean that it cannot be leveraged to perform process
injection, however, as we'll see later.
At https://github.com/antifob/linux-prinj/blob/main/14-pvwm you'll
find an example usage of this technique. It puts the shellcode on
the stack (rw) and inserts a ROP chain (built from dynamically
found gadgets in libc.so) at rsp's value. When the process returns
from the running function, the ROP chain invokes mprotect
to make the stack executable and, finally, jump to the shellcode
(on the stack, now executable) for arbitrary code execution.
This PoC doesn't maintain the process's integrity, though.
This is left as an exercise for the reader.
At https://github.com/antifob/linux-prinj/blob/main/14-pvwm-spray you'll
find variation of the above technique that avoids using ptrace
by using a stack pivot gadget and spraying the stack with its
address. When the victim process has its stack pivot, it starts
executing a ROP chain that marks the stack executable and executes
the shellcode.
Loading the payload
So far, the fundamentals of process injections have been covered:
writing to memory, the destinations and how to control execution.
This is enough to get code injected and executed, but, as we've
mentioned, being non-disruptive is an important property for an
injection. Until now, we've inserted our payloads' return address
at its beginning. Another frequently used technique is int 3:
the debugger exception.
int 3 is an interrupt that enables a process tracer to recover
control of execution. It is most commonly used for setting up
breakpoint breakpoints; which reverse engineers and binary exploit
developers know pretty well. Whenever the int 3 instruction is
executed, (1) the program pauses and yield to the kernel, and (2)
the kernel adds a SIGTRAP signal to the tracer's signaling queue.
Upon reception of that signal, the tracer is able to perform
whatever actions; such as resuming the tracee. This allows, for
example, an injected-into tracee to be continued (PTRACE_CONT)
until the payload is ready to yield control (by executing int 3).
A PoC is provided at https://github.com/antifob/linux-prinj/blob/main/15-int3
There are multiple ways the loading phase can synchronize with the payload to pass context restoration data.
Payload types
Anyone with a bit of binary exploitation background will know that shellcodes stem from carefully written assembly programs that, when the instruction pointer starts pointing at, do something. So far, that's what we used for our PoCs; a small shellcode that prints "Hello World!" once in a while. As an attacker, though, we'd like to perform much cooler stuff: start a reverse shell, an HTTP server, scan memory for secrets using regular expressions, etc. Being lazy, though... we'd prefer avoid writing assembly and use a higher-level language instead. This section presents alternatives to shellcode injection. These are much more frequently used by sophisticated actors, but there's nothing particularly difficult about them so let's look at them.
Injecting executables
Injecting executables is a long-known technique to workaround the pain that shellcode development can be. Sometimes called ul_exec, for userland exec, this technique uses an ELF loading program responsible for parsing an executable ELF file, map it into memory, prepare everything for its execution (setup the environment variables, argument vectors, etc.) and execute it. The loader may even be able to resolve dynamic libraries. This type of payload, composed of the loader and the executable, allows for virtually any kind of programs to be injected; whether written in C, C++, Go, Haskell, etc.
The technique is neither simple or complex. At a high-level, whenever a program is executed, the kernel prepares a new virtual address space and does a few things, more or less:
- read the program's executable and copies its different sections in memory;
- setup a stack;
- copy the environment variables to memory;
- copy the argument strings (read: command-line) to memory;
- setup a structure called an auxiliary vector (auxv or auxvec) in memory;
- setup pointers pointing back to the environment variables and argument
strings (
envpandargv) - place the arguments number/count (
argc).
The auxiliary vector is a data structure containing various parameters for the process. Among others, the program's base address, its entry point, the value of the stack canary, the page size, etc. These values are mostly used by the program's interpreter, if any.
When the kernel is ready to execute the process, it checks if the program
has an interpreter (specified in the program's .interp section). This
interpreter is responsible for further, specialized, preparation of the
execution environment before fully giving control to the program. The
most common interpreter is the C dynamic loader (e.g.
/lib64/ld-linux-x86-64.so.2). The C dynamic loader is "simply"
responsible to load the runtime dependencies of the program in memory
and prepare the relocation table accordingly.
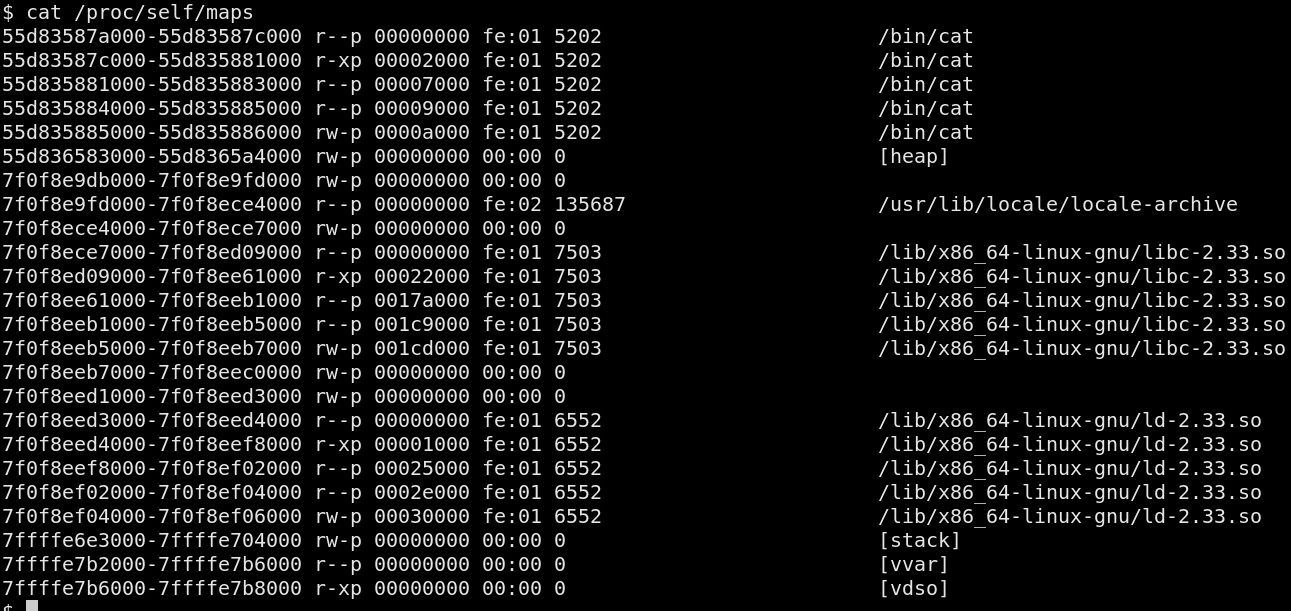
So, when an interpreter is defined, the kernel loads its program in
memory and jumps to its entry point. The interpreter does its thing
and then uses the auxv structure to jump to the main program's
entry point. Notice that /lib/x86_64-linux-gnu/ld-2.33.so, the
dynamic loader, is present in memory in the screeenshot below.
It might be surprising to the reader to learn that this type of behavior
is relatively common.
The well-known upx packer, for example, works exactly this way. It
compresses the executable, and wraps it with a small decompression and
loading program. The product of this process is a (hopefully) smaller
executable that, when ran, decompresses the executable in-memory,
loads/maps it and executes it.
A demonstration of the ul_exec technique can be found at
https://github.com/antifob/linux-prinj/blob/main/16-ulexec
Executables can be injected into processes and executed as if
execvewas used.
Injecting statically-linked executables
When injecting statically-linked executables into statically-linked executables (phew!), there's a risk that their address spaces collide and the injected binary will simply fail to load. To avoid this situation, statically-linked executables meant to be injected should use an alternate base address.
Shared libraries
An alternative to injecting executables is injecting shared libraries.
They, too, can be written in about any languages, but are generally
much easier to load (for the simplest ones). Shared libraries are, in
essence, quite similar to executables. They have .data and .text
sections, an entry point, and dependencies, for example, but do they
have some key differences: symbols and structure, among others.
Still, fully loading libraries is a complex task and out of this series'
scope. Know that the most written about shared library injection technique
involves invoking the __libc_dlopen_mode function, part of libc.so
(usually already loaded in the process's address space). This particular
technique requires writing the library to disk and invoking
__libc_dlopen_mode with the library's path. This makes it not
particularly stealthy or flexible, but we'll look at ways to avoid
dropping the library on disk in part 4.
A demonstration of this technique can be found at https://github.com/antifob/linux-prinj/blob/main/17-solib
Shared libraries can be injected into processes and one of their functions executed when they're loaded.
What we've seen so far
As I've demonstrated above, process injection techniques are essentially structured around two (2) capabilities: being able to write to a process's memory and being able to change its execution path. These capabilities are possible through a small set of facilities, but can be combined in many different creative ways. Additionally, a technique's disruption impact can be handled, or not, using an even bigger set of facilities.
Process injection approached in a structured manner are much easier to reason about. They're not necessarily simple, as there are a lot of pieces that need to be considered, but they don't need to be difficult or obscure. This article was designed with the goal of demystifying them and I sure hope that, by reading this article and studying the PoCs, readers will be able to better approach them and help their organizations improve their defense.
Be sure to look at the next article in this series; which will present preventative and detection measures. In part 4, things will be taken a step further and I'll be presenting various tips and tricks to design better injection techniques.
Articles in this series
- Part 1 - Introduction
- Part 2 - Injecting into Processes
- Part 3 - Prevention and Detection
- Part 4 - Advanced Injection Topics
- Part 5 - Technical Reference
Recommended reading
References
- Drysdale, Dave - Anatomy of a system call, part 2
- scut, grugq - Armouring the ELF: Binary encryption on the UNIX platform
- clone(2)
- grugq - The Design and Implementation of Userland Exec
- elf(5)
- execve(2)
- fork(2)
- mmap(2)
- mprotect(2)
- proc(5)
- process_vm_writev(2)
- ptrace(2)
- Re: Yes, people use FOLL_FORCE ;)
- setitimer(2)
- sigaction(2)
- signal(2)
- Silvio - Shared Library Redirection via ELF PLT Infection
- T1055.008 - Process Injection: Ptrace System Calls
- T1055.009 - Process Injection: Proc Memory
- T1055.014 - Process Injection: VDSO Hijacking
- timer_create(2)
- timer_settime(2)
- vdso(7)
- waitpid(2)
This section is quite long and I don't think it would be useful to dillute the content. ↩︎
https://bugs.launchpad.net/ubuntu/+source/python2.7/+bug/1452115 ↩︎
I'm simplifying for the sake of understanding. ↩︎
A demonstration of this behavior is available at https://github.com/antifob/linux-prinj/blob/main/misc/ptrace-pepouser ↩︎
The "punch through" capability was, at one point, removed from the kernel. After a complaint from users to the lkml, the behavior was restored. ↩︎